Overview
This document serves as a data/process descriptor for the code available at the project github repo. Note that what is included here is far from exhaustive. The aim, instead, it to highlight the main methodological steps as well as to provide a better understanding of the open source code developed to support the modelling exercise.
Note
Detailed documentation supporting this project is available here.
General info
The methodological approach of this exercise is visually presented below.
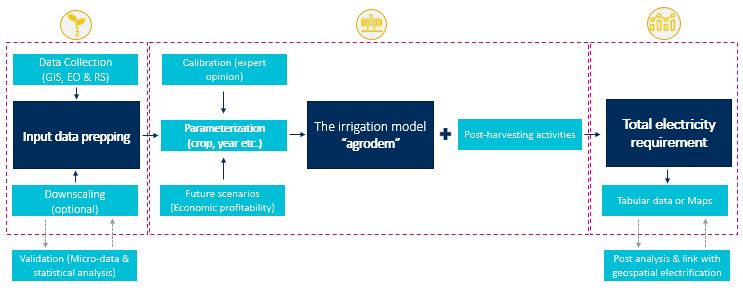
Methodological flow and key modelling elements of this exercise
The core part of the methodology is the irrigation model, which was developed to provide an estimate of crops’ water and electricity requirements in a designated area of interest (AoI). The ‘agrodem’ model has been constructed as such to allow for its full customization by the user based on available data, information and other modelling constraints.
Downscaling methods have been explored in ordert to overcome data limitations or low resolution crop allocation data. The supporting metholology can help users build up input data in higher resolution using existing tabular data from surveys or statistics.
To evaluate future scenarios, relevant code was developed in order to enable users explore hypothetical alternative scenarios of cropland expansion (“extensification”). This component enables the user to evaluate the impact of expected changes to crops, as well the impact that policy can have on the expansion of crops to new areas over time. Users can interact with the code and create alternative future scenarios that best suit the purpose of the modelling exercise.
Finally, the model has been augmented to allow for assessment of electricity requirements for post-harvest activities (milling, drying, pressing, cold storage etc.). The model was developed as such to allow calibration of input data depending on the type of crop and AoI.
The components described above, create important blocks of work. Each block describes a particular activity and is usually characterized by three elements, namely input – process – output. It also comes with open source code (available in the form of jupyter notebooks) that provides a clear step-by-step description of how to run embeded processes. Sources are linked where needed (e.g. equations, specific values, assumptions etc.) for transparency and open review.
Note
This is a spatial analysis, therefore some processes require either the installation of spatial libraries in python or the use of a GIS (check QGIS) environment. It is recommended that the user uses Python >= 3.5 through anaconda distribution; all required python packages are included in the full_project_environment file. QGIS plugins developed and used in this exercise come with separate documentation on installation requirements.